
How Relevant Is Data Visualisation?
Smart digital assistants like Siri and Amazon Alexa have helped showcase the power of data in our personal lives. Consumers are now aware that their lives can be made much better if they allow technology to harness all the data they generate from cyberspace activities. Businesses have been talking about harnessing data for even longer, but the average business person faces multiple challenges to use data.
Why Businesses Struggle With Data
First, there is no simple package like Amazon Alexa that will plug into your business life and begin to automate every data process for you. Thus, applying data to business is much more complex and requires an understanding of your business in its context. An app that is right for one retail business might not make a difference at all for another.
Secondly, the multi-layered nature of business decision making, as good as it is for governance, can actually impede adoption of new tech practices.
Applied Data Visualization For Businesses
Fortunately, data visualization is one easy step where most businesses can begin to find value from all the data their businesses generate every day. Particularly as the future of retail goes increasingly digital, data will become ever more critical for making the right business decisions.
From customer service metrics and financial data to sales data, businesses will need to become adept at making decisions from accurate data visualizations.
How Data Visualization Can Help Business Decisions
Before delving into applications, let us first define data visualization, with a particular look to business contexts.
According to SAS, “Data visualization is the presentation of data in a pictorial or graphical format. It enables decision makers to see analytics presented visually, so they can grasp difficult concepts or identify new patterns.”
Data visualization has broader applicability than some business people might assume. It applies not to finance and sales only, but to any activity that can be measured and improved on the basis of hard metrics.
Below are some areas in which you can apply data visualization:
- Finance - Financial data visualizations can show how the business spends its money, and how much return each dollar earns
- Quality Control - If you manufacture your own product, data visualizations can show the frequency and types of product defects
- Sales and marketing - You can use data visualizations to illustrate all the different conversion points in your sales process and how effective they are
- Customer Service - Use data visualizations to measure the quality of your customer service
- Team Management - Data visualizations can track team growth, training, and productivity
- Order Fulfillment - Use data visualizations to study how long it takes for customers to get their products after they click “Buy” and submit orders in your store
A Data Visualization Case Study
To see how the process of data visualization looks like in practice, we will go over a notable data visualization project from the US government.
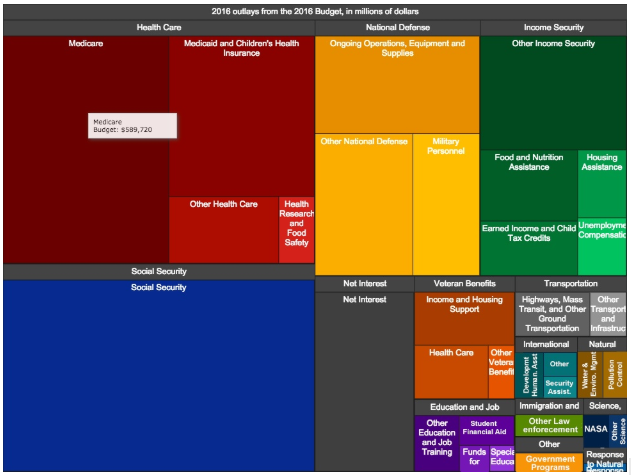
Image Credit: Interactive Government Budget/US Office of Management and Budget (2016)
This data visualization shows the 2016 US national budget, and is remarkable for how informative and yet thoroughly easy to understand it is. Just by looking at it, even a layman can draw some actionable insights from it.
For example, it is easy to see the general trends of US government spending, and which items draw the most money. We can see, for instance, that Social Security and National Defense are the biggest items on the US budget, followed by Medicare.
The benefits of this visualization include the transparency it fosters for stakeholders, and its aiding of efforts to educate the public on budgetary allocations.
Any business will need to make similar considerations for armings its decision makers with the data and insights they need to make informed decisions.
Applying data visualization to your own business need not be a daunting proposition. With a few simple steps, you can create highly useful data visualizations. On the basis of these visuals, your business can make decisions faster and more accurately.
Step 1: Work With Data Scientists To Identify Important Business Data
The first step in using data visualization in your business is easy to overlook. It involves working with experts at data, preferably data scientists in your organization or brought in as consultants.
Anyone can claim to be an expert at working with data, but the reality is that few individuals are trained in the specific statistical and other validation science required to make data truly bulletproof.
Data scientists are experts at the application of the scientific process to business data. This designation usually requires a Master of Science degree or even a PhD, though some candidates with experience can also be considered.
Your data scientists will help you identify the critical data that your business needs and that can be depicted visually to aid in business decision making.
Step 2: Collect Data Using Data Collection Technology
You cannot visualize the data if you do not first collect it. Therefore, after you and your data scientists have identified the business data that will be useful to visualize, you must collect the data.
For this step, you will typically need tools that plug into your business, automating the collection of data, and providing ongoing data collection.
Some data collection tools to explore include:
Step 3: Aggregate Data Into Visual Dashboards
With data in hand, and an automated data collection system feeding you a constant stream of data, you can now actually aggregate this data in visual form. Be creative with this step, since different data types lend themselves to different types of visuals.
You can create basic dashboards consisting of pie charts, bar charts, priority rankings, and other simple data visualizations to begin with.
Later, you can explore more complex data visualization formats such as heat maps and hyperbolic trees.
Step 4: Interpret the Data Using Domain Knowledge and Act On It
Businesses need clear guidelines on how to interpret and act on data as made available through mechanisms such as data visualizations.
Think of your business decision makers and workers as pilots flying a plane with the aid of dashboards showing them all kinds of relevant external data. They can look at the data, but if they do not act on that data and act on it accurately, disaster will ensue.
This is why you need sound and adequate guidelines for how data is to be acted upon. If necessary, provide training to every team member who is to be entrusted with the interpretation and use of key data.
Making Business Decisions Based On Data
We have seen that data visualization is a technique by which otherwise static data can be made visual and actionable. Data visualization can be applied to almost any area of business, as long as there is data available and decisions can be effectively made on the basis of the observed data. This means that departments like finance, HR, marketing, and product quality, for instance, can all make use of data visualization techniques in their operations.
To design valid data visualization flows, you might need the help of a data scientist. Applying the data and drawing conclusions from it will need personnel with the requisite domain knowledge.
Finally, ensure that when decisions are made, they are based objectively on the available data and correct interpretations of it.